
Chapter 9
10 minutes
Sales Coaching

Taft Love Global Head of Sales Development and Sales Operations at SmartRecruiters
On my first day as Director of Sales Development at SmartRecruiters, someone walked up to me and said, “Man, you really have the team fired up. The reps are calling like crazy.” At the time, the company didn’t have any formal sales development reporting in place, but there was enough infrastructure for me to run a quick report on how many calls the team was making per week. It was a paltry sum and far from crazy: 120 calls per week across a team of four reps.

The situation I walked into at SmartRecruiters is one that many people in sales operations and management find on their first day. There was little to no process; Salesforce was a mess, and when you asked a rep how many calls they were making per day or what their connect rate was, they froze up. In this chapter, I’ll explain how we changed that.
Over the last year, my team and I have built what I would argue is the most important asset to any sales team: a coaching and training framework. Data has always been at the core of it. From the beginning, our team has followed Peter Drucker’s mantra, “If you can’t measure it, you can’t manage it.” It wasn’t always pretty, and we made our fair share of mistakes, but eventually we built robust call reporting, a systematic way to diagnose problems our reps were facing, and a data-driven coaching framework.
Step 1: Set up your reporting infrastructure
After that conversation I had on my first day, I knew that the first step toward increasing pipeline was to increase our call volume. I began by making an important hire: a former colleague and metrics-focused manager, Chris Bryson. We worked together to define and measure success in terms of activity volume. Once that was in place, I called a team meeting and shared the “Calls per week” report with all the SDRs. I’ve never been a fan of yelling or intense cheerleading to motivate a team, so I simply shared the report and walked everyone through the concept of an activity funnel in order to explain why increasing call volume was important. For most reps, this was their first experience seeing a sales and marketing funnel. Then I asked everyone how we could increase volume. Someone suggested using the dialer feature in our email automation tool and another rep suggested evaluating new sources of lead data for outbound, but the truth is that just being aware of their low performance was enough motivation to boost the numbers.
After a few months of calling, we learned two things: the team was willing to call if properly motivated, and the team’s results weren’t as good as what we had achieved at PandaDoc, our previous company. Fortunately, we had a wealth of data from which we hoped to tease out some conclusions about our performance. Chris and I began by coming up with a list of questions that we wanted to answer using the new data. Some of the questions we asked were:
- Are the reps’ complaints about low connect rate valid?
- When they do connect, how often are they successful?
- When they connect and are unsuccessful, what is going wrong?
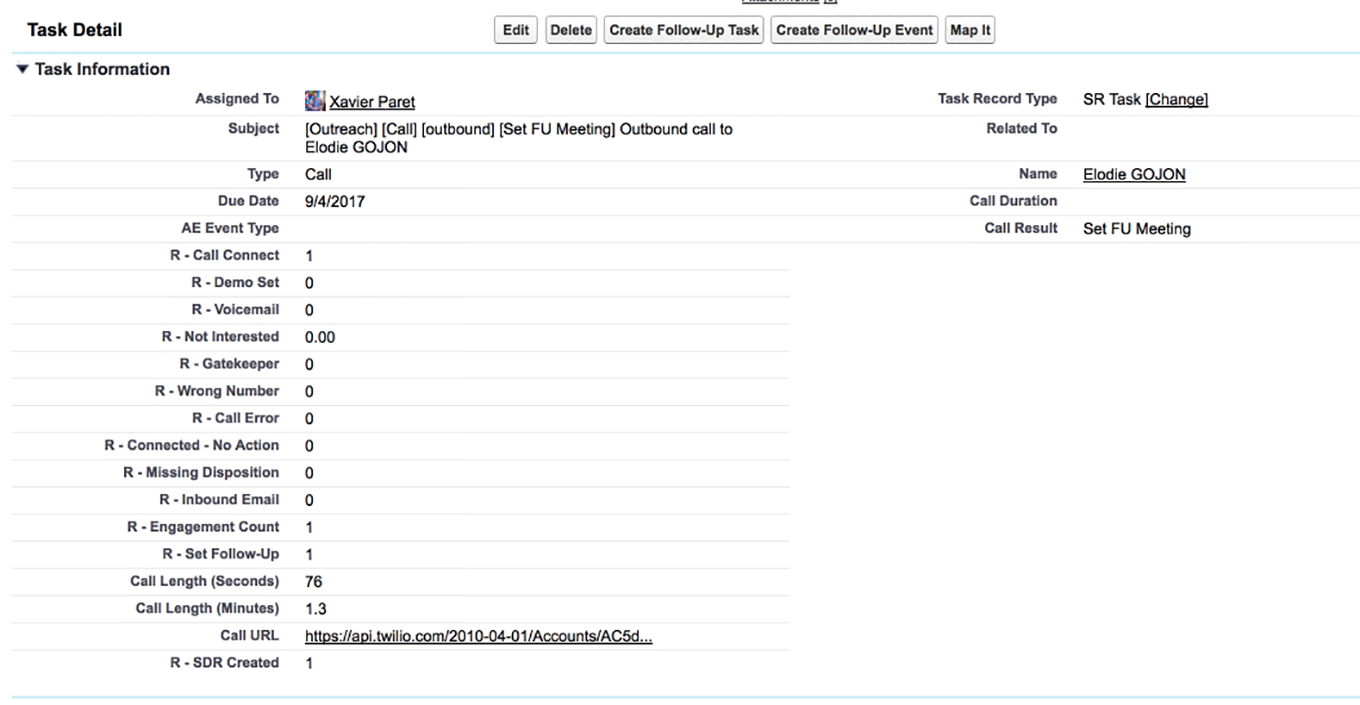
The Task record for every call in our data set included a disposition (outcome of the call) and call duration. We bucketed all of our dispositions into one of the following categories:

Unfortunately, when we started this process, our dialer, Outreach, sent the data we needed to Salesforce in a format that made reporting difficult. All of the important data was combined in text format within the task’s subject line. This format is easy for a human to understand, but impossible for a computer to use in a meaningful way. For example, if a rep called someone, connected, and set a follow-up meeting, the subject field was populated with the following data: “[Outreach] [Outbound call] [Connect] [Set FU meeting]”.
In order to turn this into useful data for reporting, I wrote a series of simple custom (formula) fields that read the subject line of each task and translated the text string into something that Salesforce’s reporting module could read. For each disposition, I wrote a formula that looked like this:
IF(
CONTAINS( Subject, “\[Set FU Meeting\]”),
1,
0)
In the above example, the formula would then push either a 1 or a 0 to a custom field named “R - Set FU Meeting?” (The R makes it easy to quickly pull up all custom fields that relate to reporting). Suddenly we could draw conclusions from the aggregate call data using these simple binary fields.
Step 2: Diagnose the problem
Once we had our reporting infrastructure in place, we started answering the aforementioned questions. The first metric we looked at was our connect rate. How often did someone pick up the phone when we called? We found that the connect rate was low, but not far below what we expected. However, as our calling increased, the connect rate seemed to dip. It ranged from a high of almost 15% to a low of 11%, depending on the month.
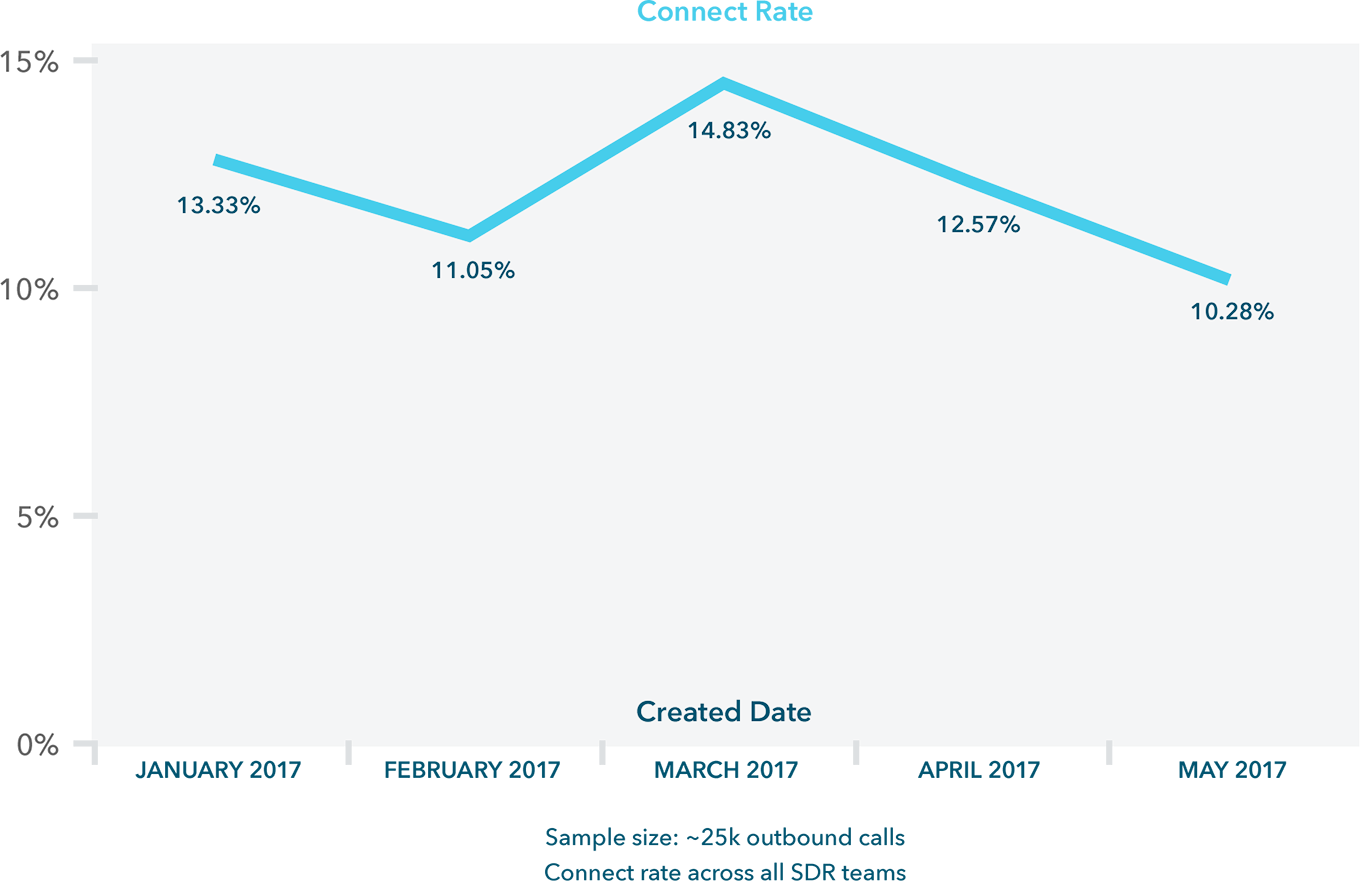
Of course, the 15% connect rate was a team average, and if you know anything about sales management, you’ll know that performance across the team varies widely. We had some reps that were connecting on 10% of their calls and others that were connecting on 20%. With that data, we looked into things like what time the low-performing reps were calling their prospects. In one instance, we had a rep on the West Coast that didn’t realize that they were making a lot of their calls to reps on the East Coast at lunch time.
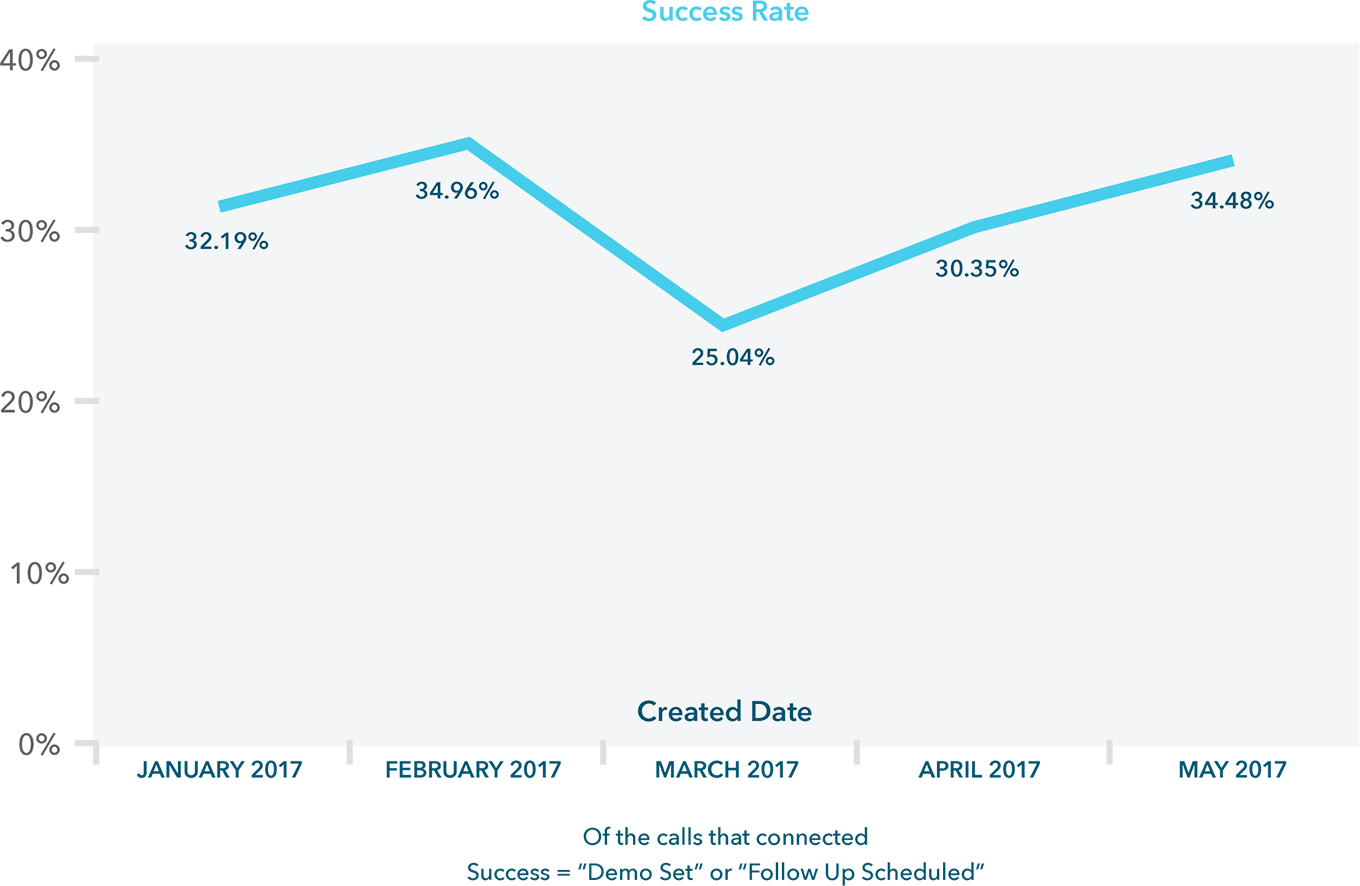
In addition to the connect rate, we looked into the success rate (the calls that connected and led to a demo or follow-up meeting). But once again, we needed to look deeper than one single metric to diagnose the problem. For example, results were choppy. Some reps had a success rate north of 30%, while others only succeeded on 1 out of every 10 connects.
In order to break this down further, we looked at each rep’s average call duration when they connected. We learned that some reps were struggling with their opener, as evidenced by short average call durations. Conversely, we had reps who were obviously struggling to convince prospects to take a meeting, since they had average call durations of 10 or more minutes and didn’t result in a demo or follow-up meeting.
Step 3: Create a training framework
All of these reports helped managers use data to inform their 1:1 coaching, but we also started to see trends that required training the entire team. Over a whiteboard session, Chris and I began mapping out the training framework that is in place today. We knew that it was essential to get our team’s buy-in, so our first action was to get everyone in a conference room to explain our plan.
In the meeting, we explained to the reps that as a group we had all been struggling with a few things (for example, our outbound email response rates were too low to achieve our team goals by focusing on email).
We reminded them that a spot on the team required one of two things: delivering results, or working hard and following a process (though preferably both). Then we explained the new training framework. For each training topic, we would do the following:
Host a presentation
One of the sales managers or high-performing reps would give a short presentation on a skill or new tactic that we wanted the team to try.
Team Q&A
After the presentation, we would discuss the content as a team. This was a chance to ask questions and to suggest tactical changes they could make to their workflow.
Homework
Each rep would be assigned homework after the presentation. For example, if the presentation was on probing for pain on a qualification call, the assignment would be to try the new tactic and then listen to a recording of the call and provide a self-assessment for how well they did.
Manager review and 1:1
The sales manager reviewed the homework assignment and then had a 1:1 to discuss. In the pain-probing example, they would listen to the same call and provide their own feedback.
Two examples of training we provided were helping reps open calls and helping them close calls. As I mentioned before, we ran an analysis on the failed calls for each rep to see how long they lasted. About half of them weren’t getting past the first minute or two with a prospect, and the other half were spending 10 or 15 minutes on the phone and still failing to set up another meeting. So Chris, the wizard of call-scripts-that-don’t-feel-scripted, developed a series of trainings. We met with the team, Chris presented and explained the scripts, and then reps started implementing the new openers and closers. Because Chris left the scripts as more of a skeleton than a rigid word-for-word script, reps were able to deliver them in their unique voice. Then if that wasn’t working, our 1:1 coaching sessions could get them back on track. Immediately we saw our success rates climb.
Here are the scripts we use today.
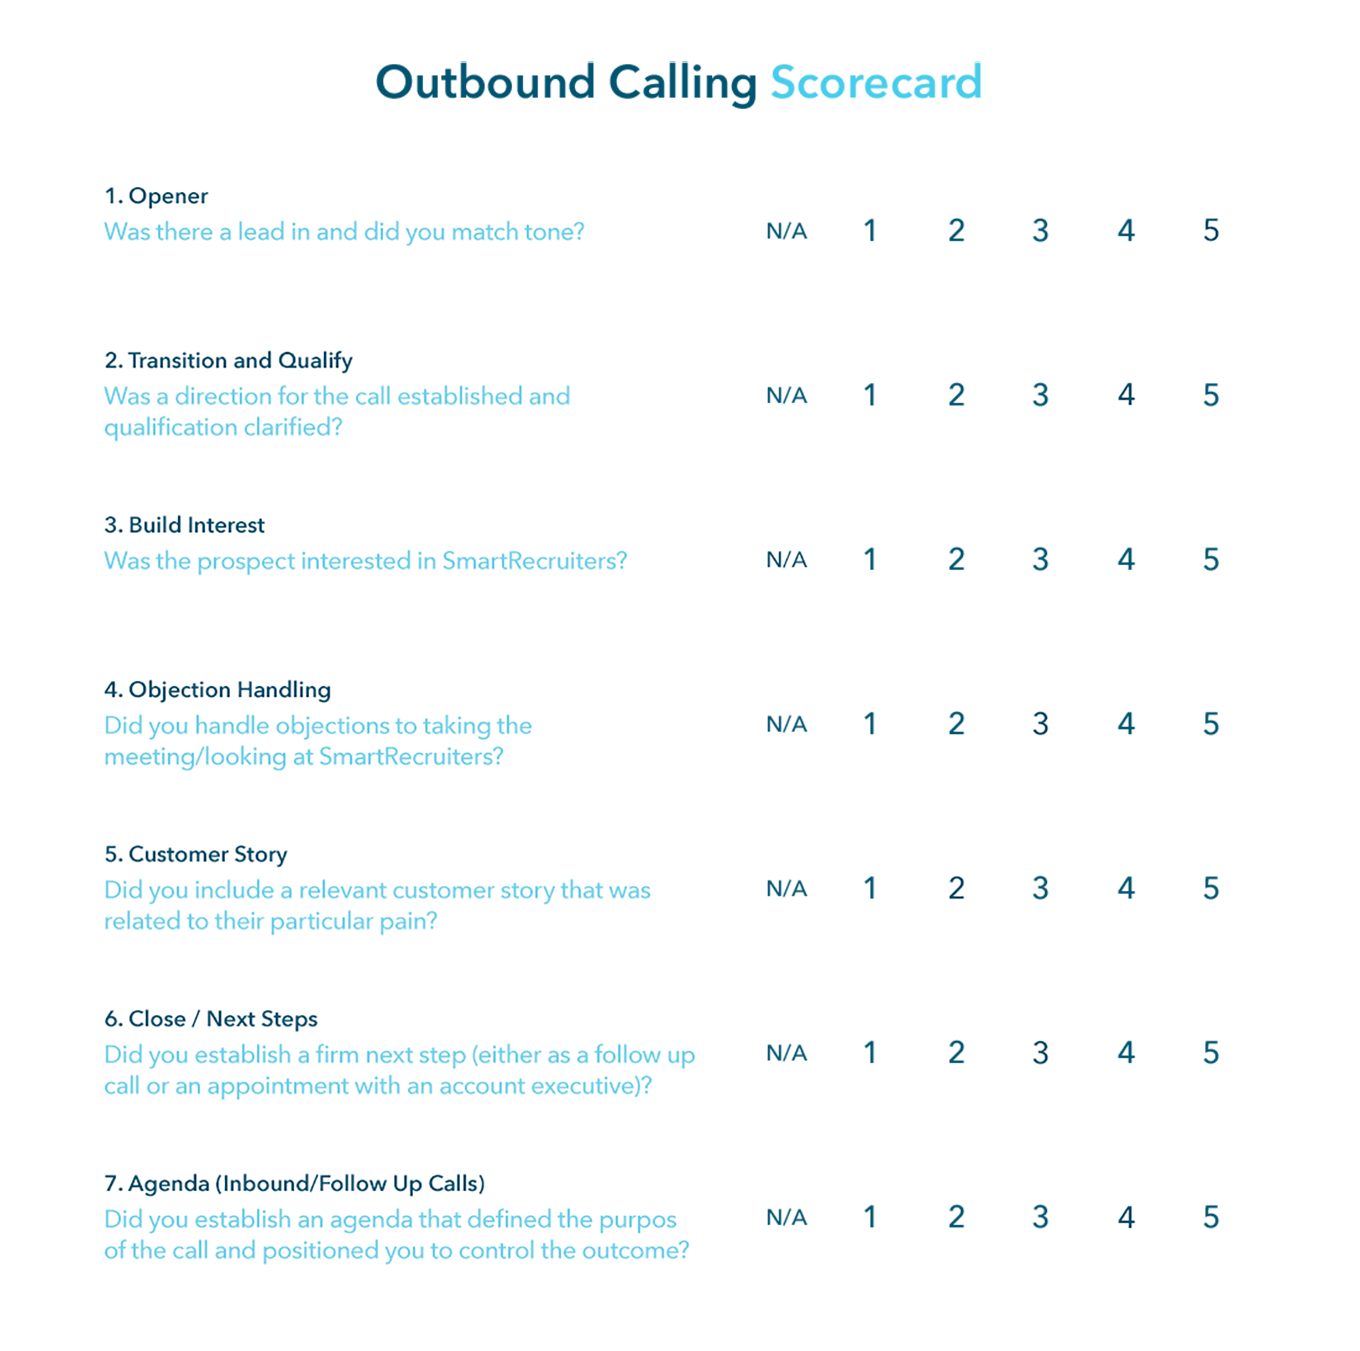
As soon as we started delivering feedback to our reps, Chris and I knew that we needed a way to track the feedback and house all the data. That led us to start trying out products like ExecVision, Gong.io, and Chorus. After a month of testing each product, we chose ExecVision and started using their scorecard feature to deliver consistent feedback at scale. But we didn’t want to inundate reps with a bunch of post-call questions and a heavier workload, so we introduced each area of self-assessment with the trainings every two weeks. For example, when Chris gave his presentation on opening scripts, he asked reps to start assessing their calls with a simple 1–5 score. We asked them to answer a simple question: “Was there a lead in and did you match tone?” After a couple weeks, we introduced a second question. And so on. Today the scorecard has seven questions that reps answer after each call.
When I first read sales management books on training, I thought giving reps homework like this and asking them to assess their skills so frequently would be condescending. But interestingly, I found that reps actually welcomed the feedback. Many of them had no professional experience or had never worked in a company with good management, so they were starving for this type of tactical feedback. The structure we put around our coaching also made the feedback feel less arbitrary. Every rep knew that they would get feedback each week—it was just part of the process.
On that first day about a year ago, when I sat down with the team and explained the funnel, I told them that our team is a machine. Our activity is the fuel and it’s our job to make the machine run as efficiently as possible. After all, that’s the way to take home bigger and bigger commissions.
Often, sales teams look at one part of the machine and build process around it. They may systematically A/B test outbound emails or write out call scripts and iterate on them. Rarely do teams focus on what I’d argue is the most important part: the people. While it seems almost dehumanizing to see the team as a machine to be tinkered with, like a car, it’s what everyone wants and needs. Steve Jobs used to say that if you change the direction of a vector at the beginning of its path, the change is dramatic a few miles into space. I think of sales coaching in a similar way: each improvement to the process nudges the vector a little bit. But the impact on culture, revenue, and the reps’ professional development is huge.
